THE OPIOID CRISIS
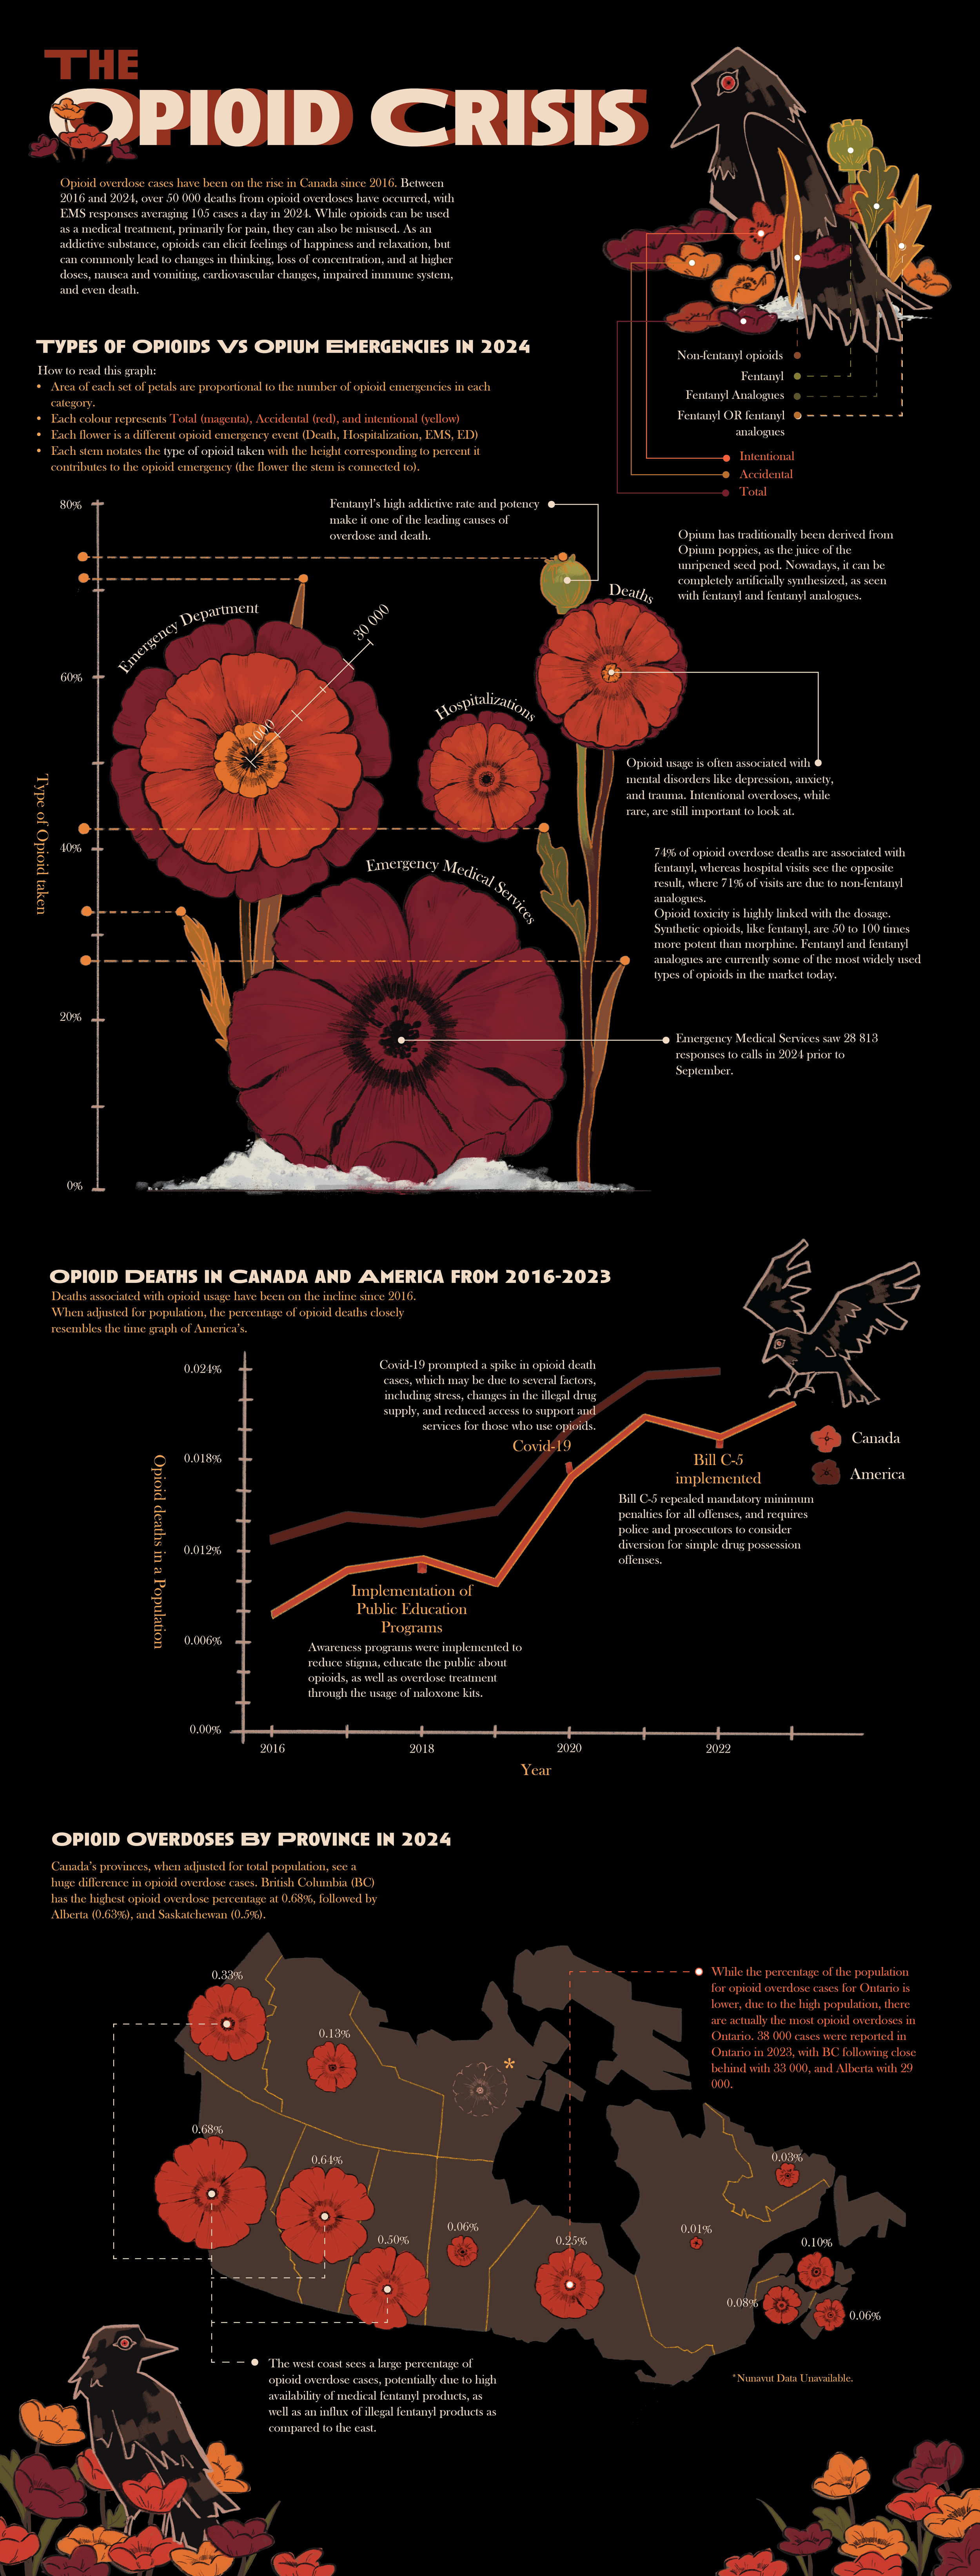
Opioid overdoses in Canada have been on the rise. This data visualization showcases statistics on hospital visits and emergencies in relation to the opioid type, deaths over the years, and Opioid overdoses by province.
Type: Data Visualization
Tools: Adobe Illustrator, Procreate, Tableau
Completion: April 2025
PROCESS WORK
01. DATA PREPARATION
After sorting and cleaning data provided by the Government of Canada, the National Institute of Drug Abuse, and World Health Organization via Tableau, it was also utilized to make the graphs for reference.
02. CONCEPT WORK
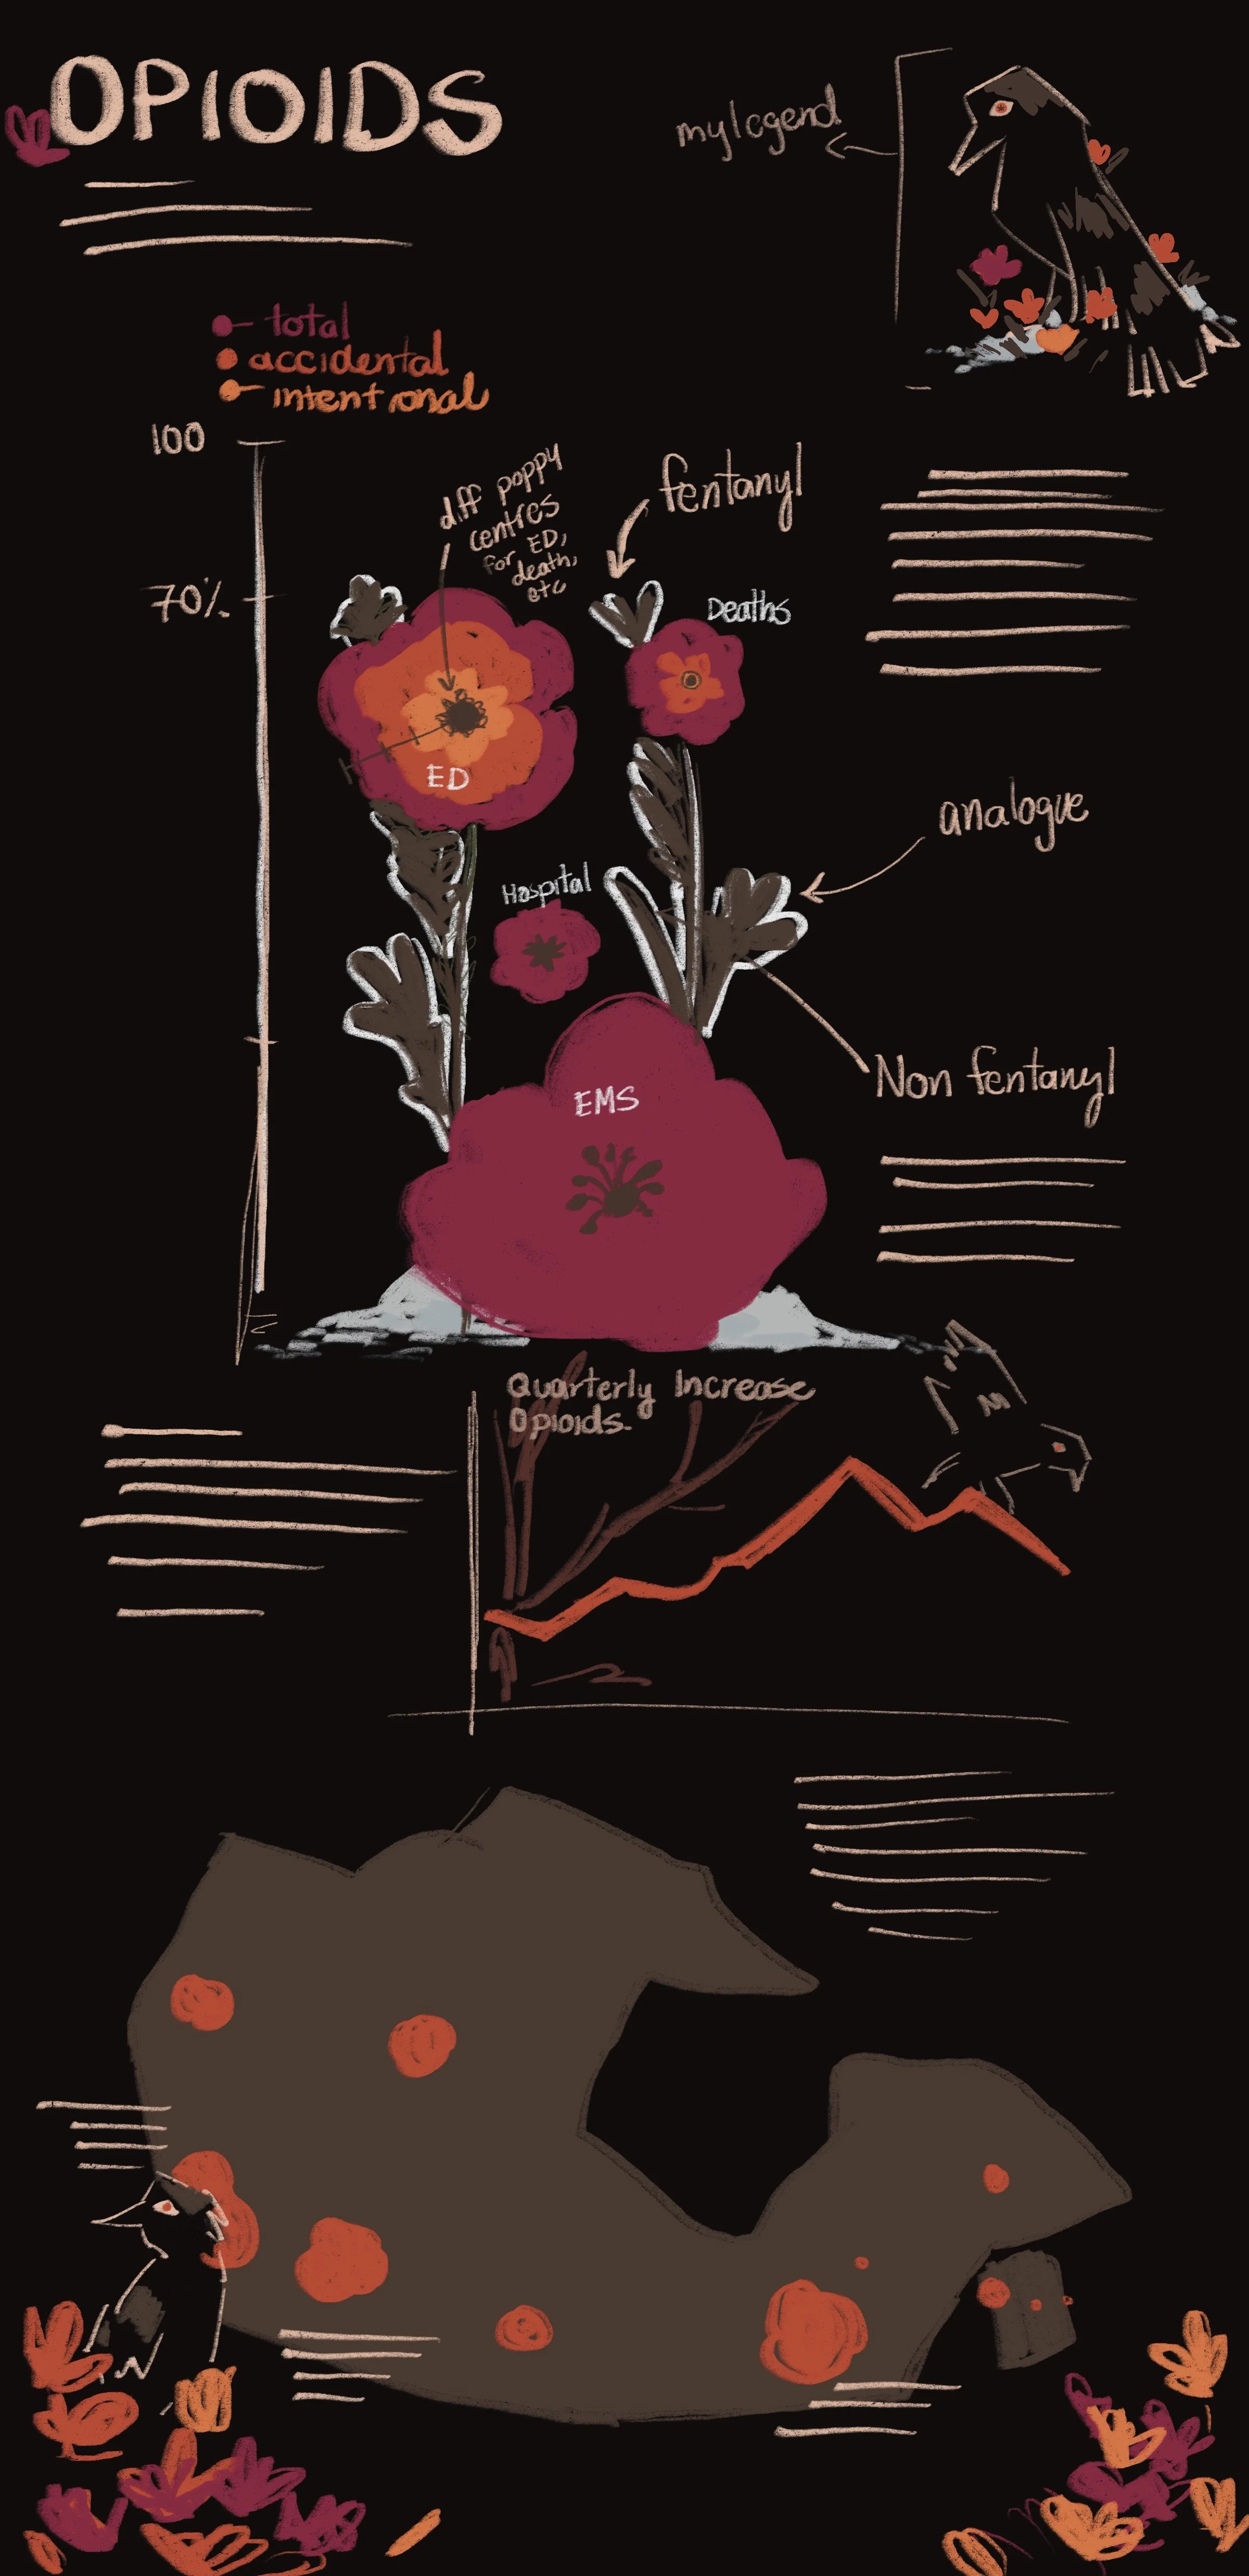
After processing the data, a concept for how the data will be visualized was created. The main poster was made to be black to add gravity to the situation, while the red theme nods to opium poppies. For the main theme of the poster, poppies and crows are used as a visual metaphor. Poppies, as they directly relate to opium, and crows, for how deadly the crisis has been. To maintain cohesion, decorative elements have been sprinkled throughout the visual.
03. REVISUALIZATION OF DATA
Once the concept has been chosen, the data has to be reprocessed to fit the aesthetic of the concept. Flowers have been drawn over top of the circles and bar charts, and the map of Canada has been redrawn to fit the style. Samples of assets can be seen on the side, prepared for formatting and use. Procreate was utilized to draw over top of the sorted and cleaned data. Assets have also been illustrated for the decorative elements as well.
04. FONT AND COLOUR SELECTION
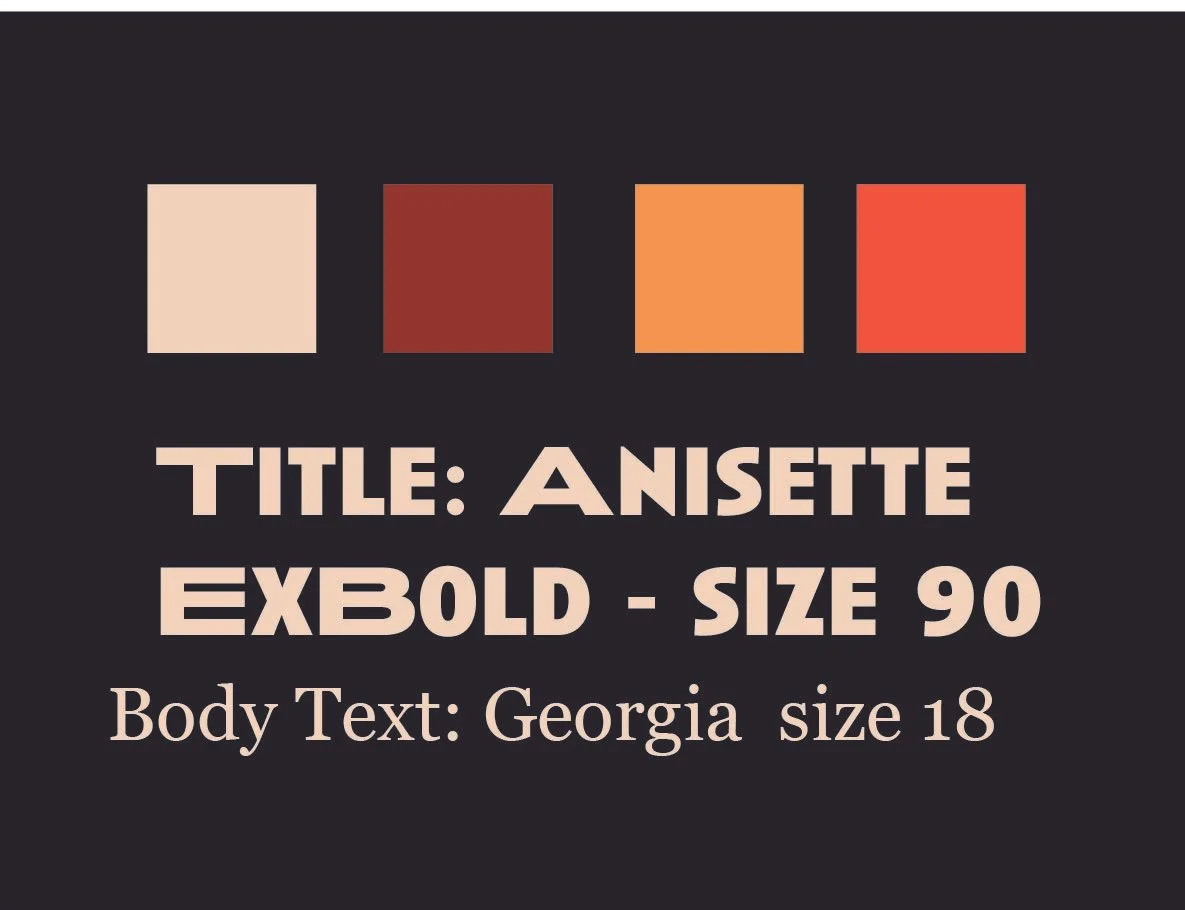
The assets are next imported into Adobe Illustrator. Prior to beginning layout, a font and colour scheme was decided upon. Initial drafts utilized Baskerville Oldface for body text, however, the font proved hard to read once printed out, thus the font was instead switched to Georgia. Original dimensions of the project was 12 x 36 inches tall, making it a large form poster, thus text was sized up to accommodate for this. Title text utilized Anisette Exbold, to fit with the slightly retro theme of the rest of the poster.
05. FORMATTING
In Adobe Illustrator, all the assets were laid out as they were in the original concept. The first version of this piece was displayed completely vertically, with each data visualization being one row of the poster. However, after deliberation, the vertical reading format made it difficult for viewers to read, especially the text near the top of the graphic. Thus, the graphic was instead switched to a horizontal view. Additionally, the ‘Types of Opioids vs Opium Emergencies in 2024’ graph, which was already a challenging graph to understand, was made even more difficult to read due to the stacked nature of the poppies. In the final version, this has been fixed to a horizontal format.
Several other formatting issues were fixed from the initial format to the final, including names of several of the graph titles, depictions of certain statistics, as well as margins, and spacing of certain assets.
05. FINAL
The final piece’s horizontal format allows for more space for the text, as well as breathing room between the different data visualizations.


